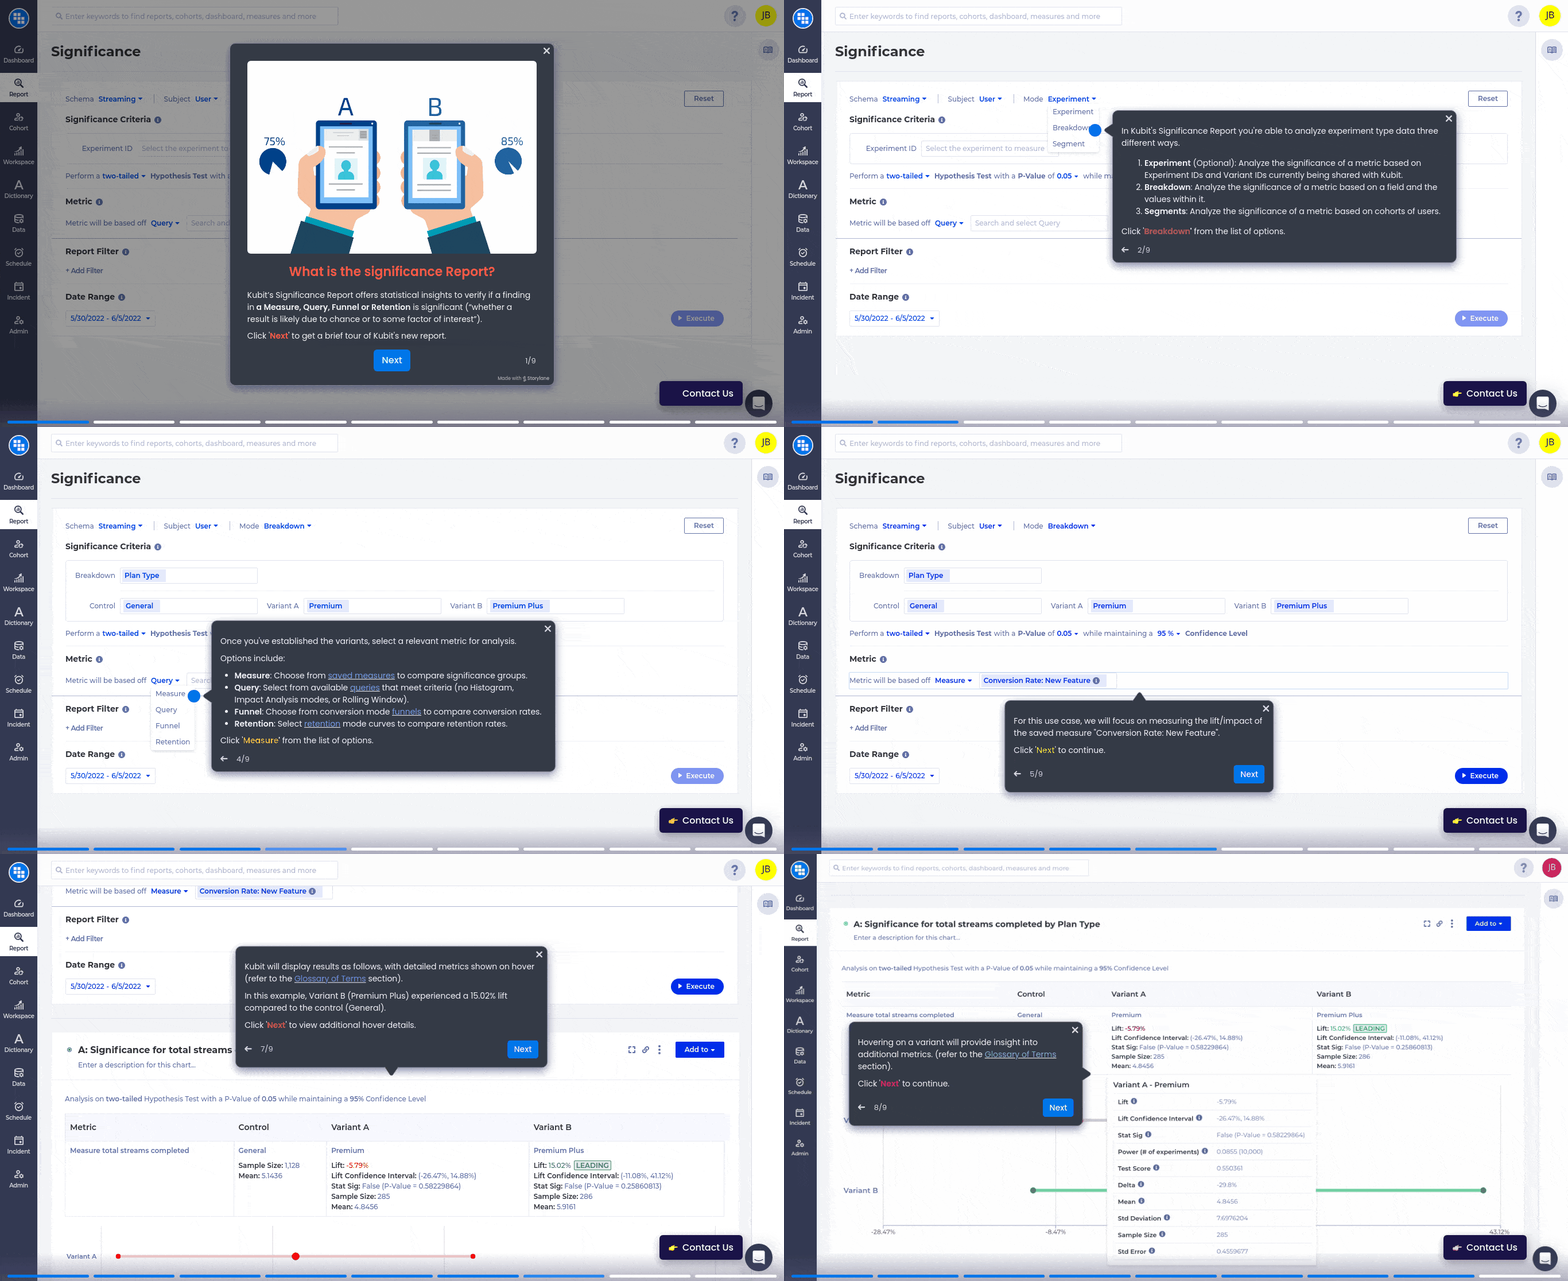
In the fast-paced realm of data analytics, staying ahead requires continuous evolution. Kubit is excited to unveil our new Significance Analysis Report, designed to effortlessly integrate and analyze behavioral, marketing, and operational data alongside your experimentation insights. Tailored for data enthusiasts and decision-makers alike, this report promises to redefine how you interpret and leverage your data. Understanding the statistical impact has never been easier. Join us in this blog post as we explore the rationale behind building this new report, its potential benefits for various stakeholders, and the diverse range of analyses it enables. Are you prepared to elevate your data-driven insights?

The Genesis of Our Significance Analysis Report
Why Did We Build This?
The demand for accurate data insights is more critical than ever. Analysts and decision-makers often face challenges managing data from various sources, leading to complexity and inefficiencies. Many customers struggle to integrate and analyze experimentation data alongside product, marketing, and operational data, often pulling from over multiple different tools.
At Kubit, we recognized these challenges and saw an opportunity to extend our capabilities. As a warehouse-native platform, we can effortlessly read data from the warehouse, making AB testing analysis seamless. Our solution, the Significance Analysis Report, simplifies statistical analysis, enhances accuracy, and empowers confident, data-driven decisions.
Who Stands to Benefit?
Experimentation Teams
For those involved in A/B testing and experimentation, the Significance Analysis Report is a game-changer. It offers clear, actionable insights into experiments, revealing metrics like lift, confidence level intervals, standard deviation, and test scores. This tool empowers you to understand what strategies work best, enabling faster iteration and more effective optimization of your approaches.
Data Analysts and Scientists
Data professionals will value this because you can use this even though you don’t have experimentation data. Hold on—are you saying this new report can be used without having pre-defined experiments? Absolutely! We’ve included additional options for data professionals to compare breakdowns or different cohorts/segments of users, simulating the same analytical power as experiments.
Decision Makers
For executives and other decision-makers, this report provides a clear, concise summary of key metrics. It turns complex data into understandable insights, making it easier to make informed decisions quickly. No more sifting through endless reports or comparing multiple charts—get the information you need at a glance.
Exploring Different Types of Analysis
Experiment Mode:
Available exclusively for customers with:
- Experiment ID or Name
- AND a Variant ID or Name
For teams focused on experimentation, this mode allows you to analyze your experiment data directly. Select your Experiment ID and related Variants to pinpoint specific audience segments. Kubit seamlessly maps these fields based on your data, providing clear insights once enabled.
Breakdown Mode
When analyzing metrics impact without specific experiment data, you can still measure lift across various dataset values such as User Type, Platform, Subscription Type, and Country. Customize your report by breaking down data values, with the option to add more Variants for detailed analysis.
Segment Mode
Segment users based on their presence in pre-saved Cohorts, enhancing the analysis similar to Breakdown Mode. Begin by creating and saving Cohorts for comparison purposes, streamlining your segmentation analysis within Significance.
Please refer to our help documentation for detailed information on the various analysis types available with Significance Analysis.


