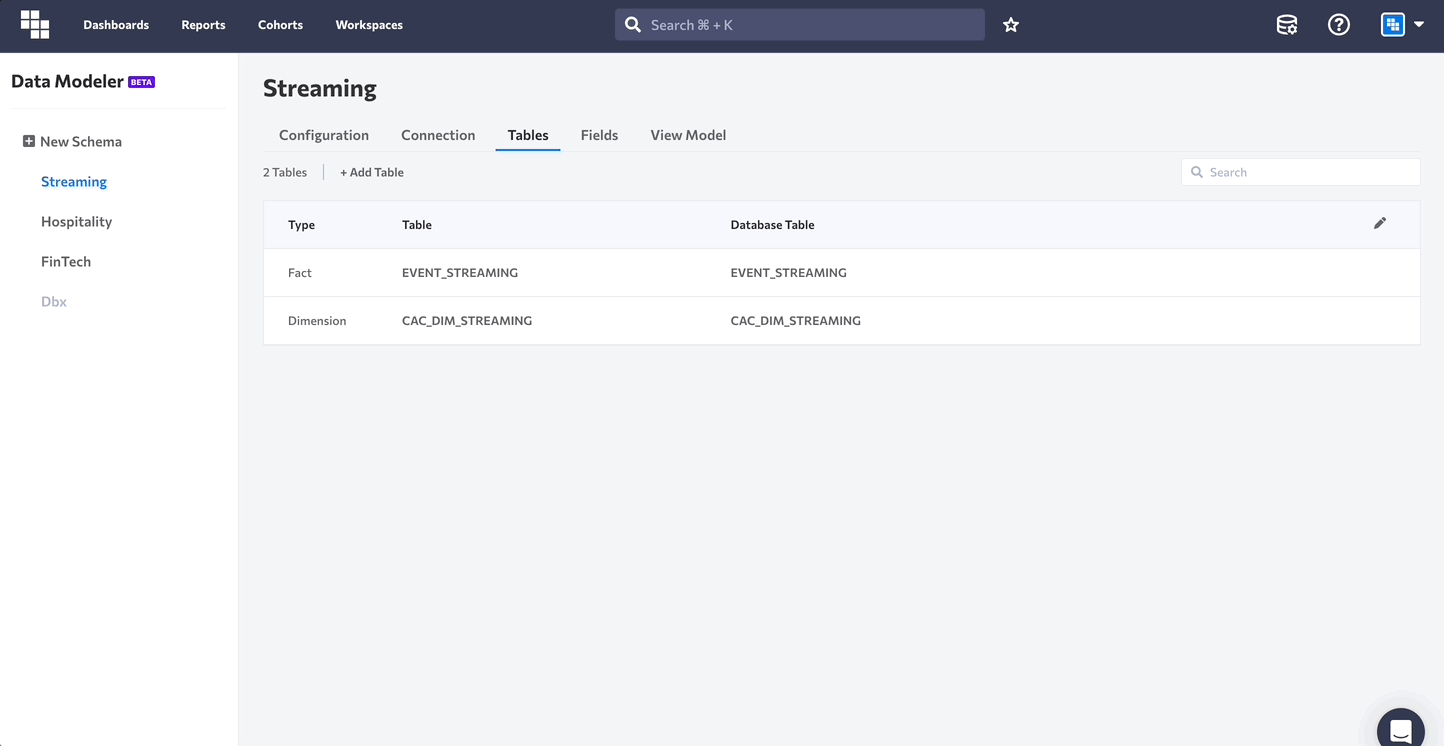
Kubit's self-service data modeler allows you to make Schema changes, create Dimension Tables, add Custom Join Conditions, and more—all without ETL or data duplication.
Unlike other analytics platforms, you can generate the SQL behind any report with Kubit. This allows you to have full confidence in the integrity of your data—keeping your existing warehouse the single source of truth.
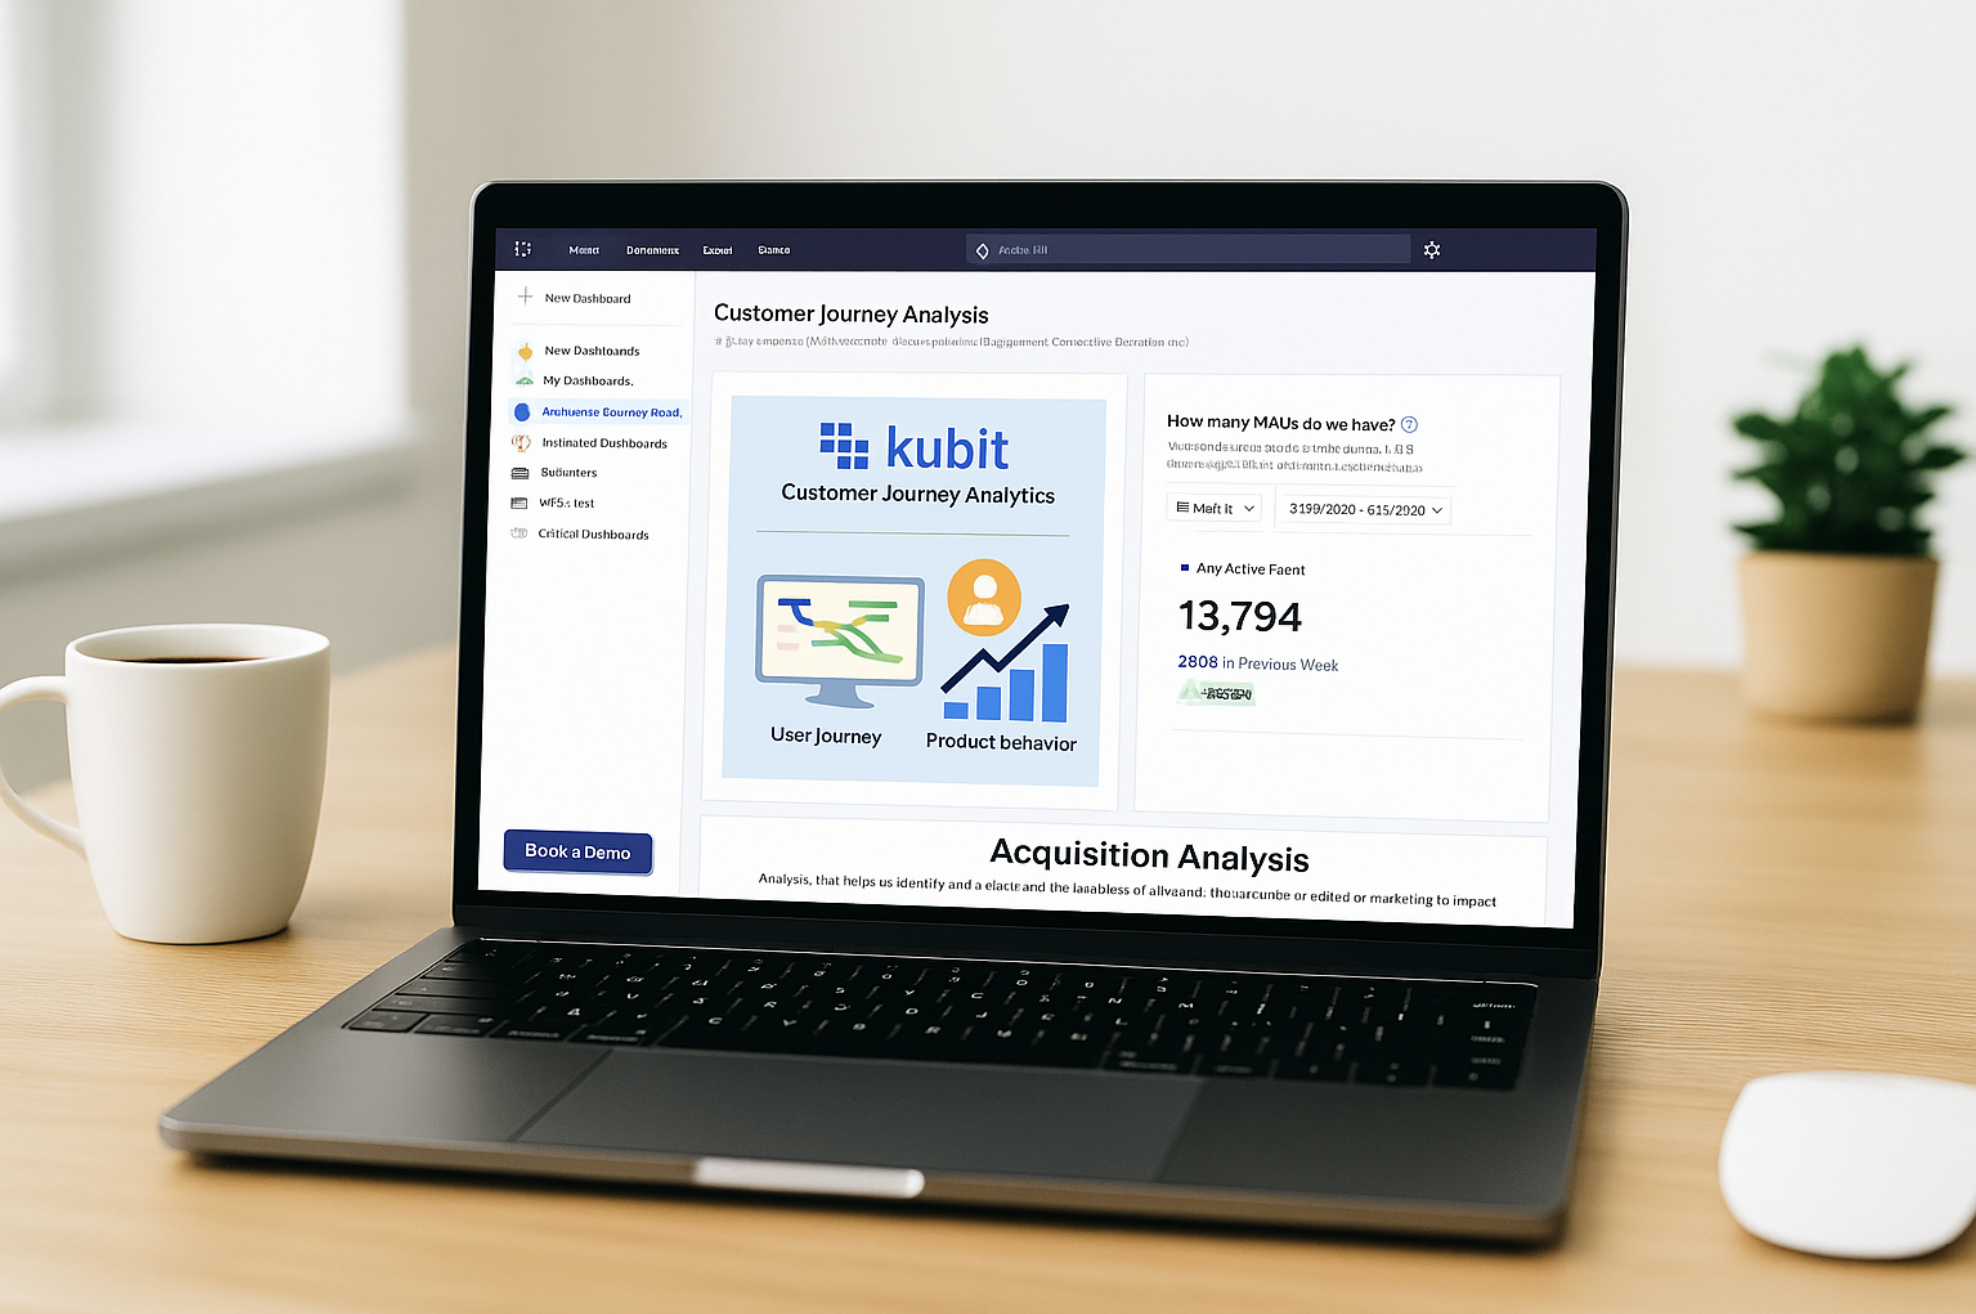
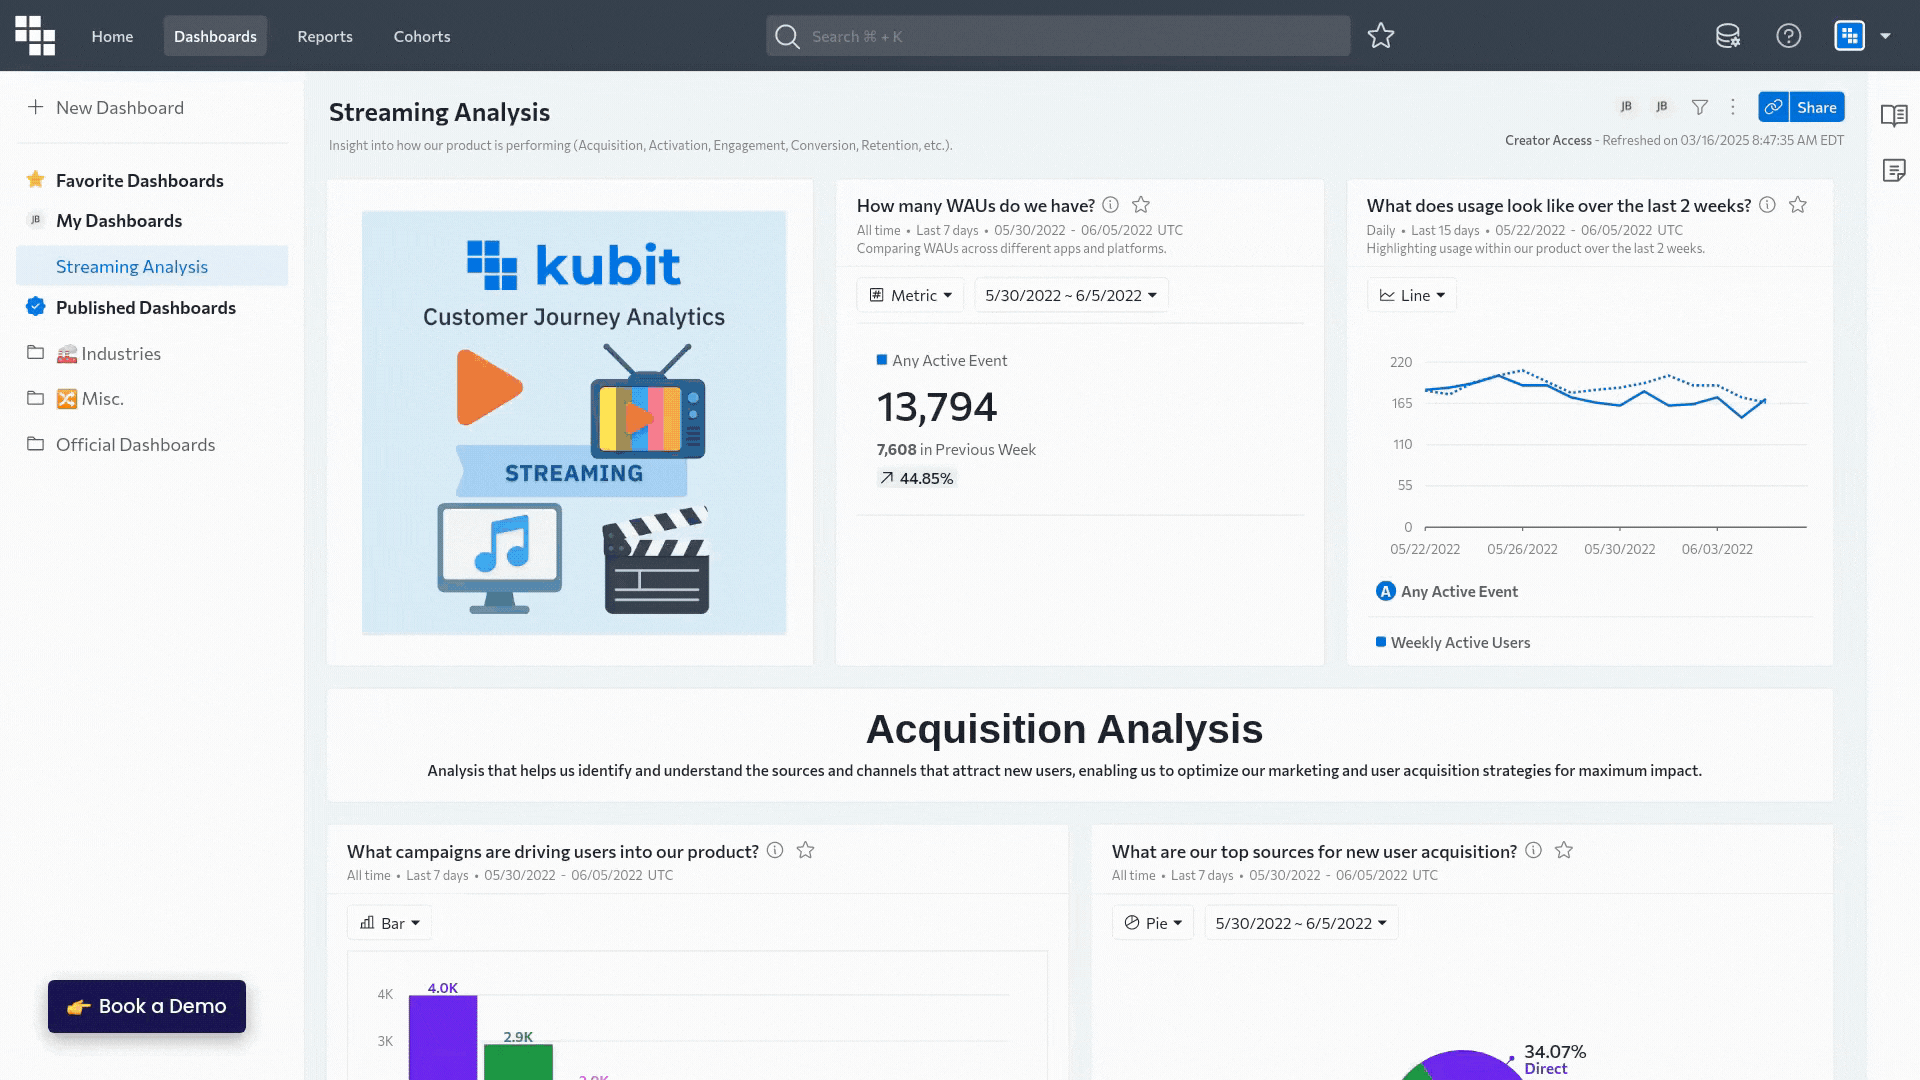
Full customer insights
From acquisition to retention, Kubit delivers complete insights into every step of the customer journey. Get answers to questions that enable you to improve the product experience and increase your customer base.
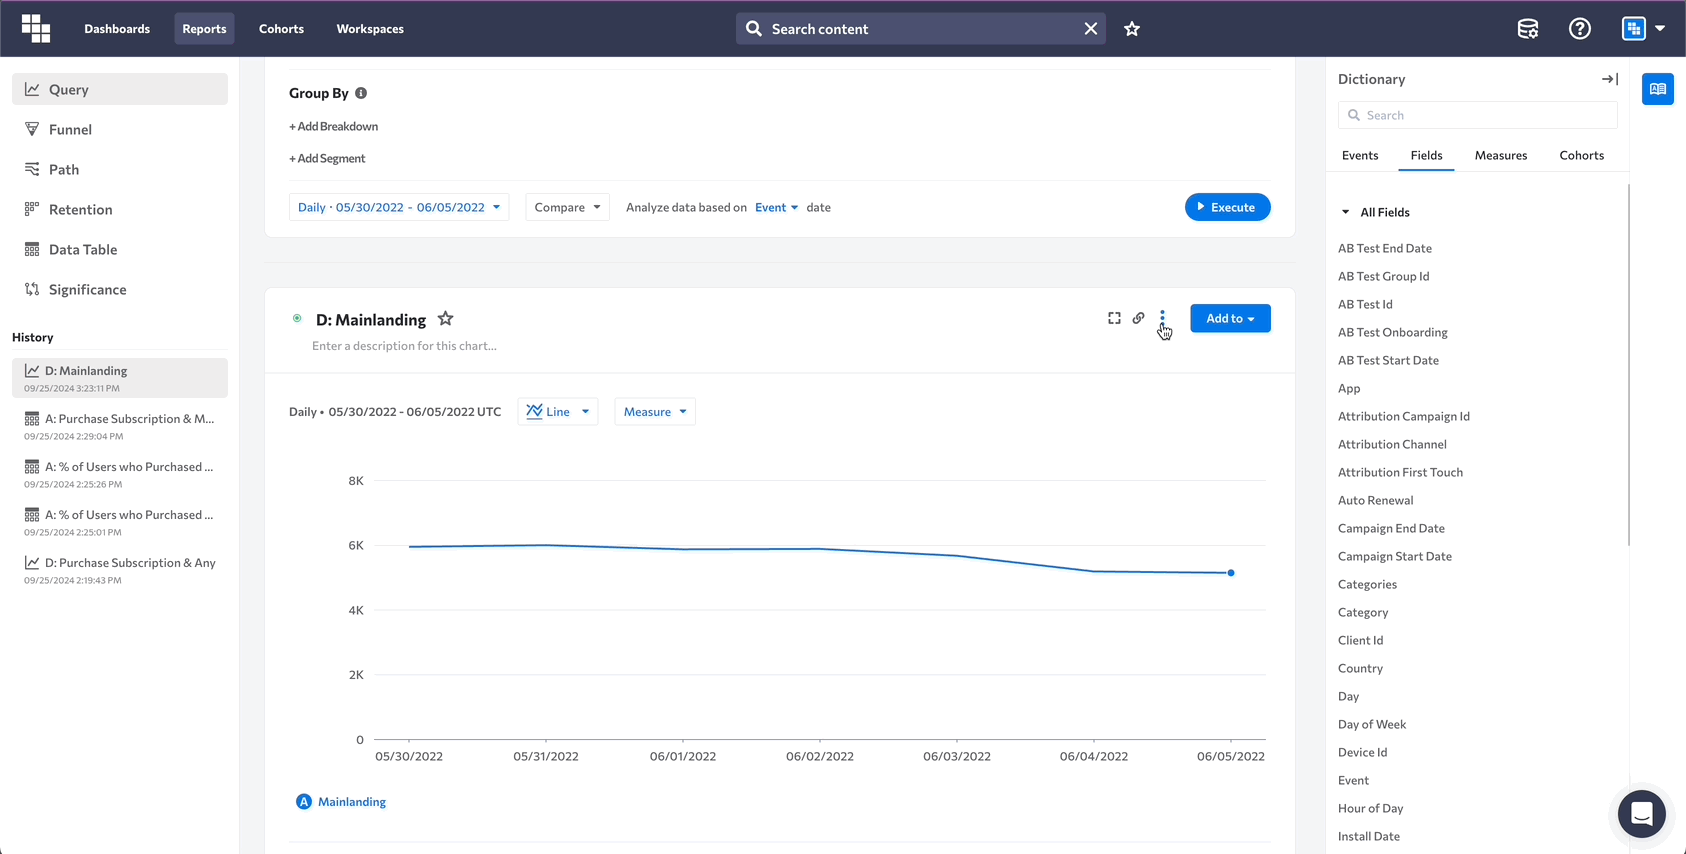
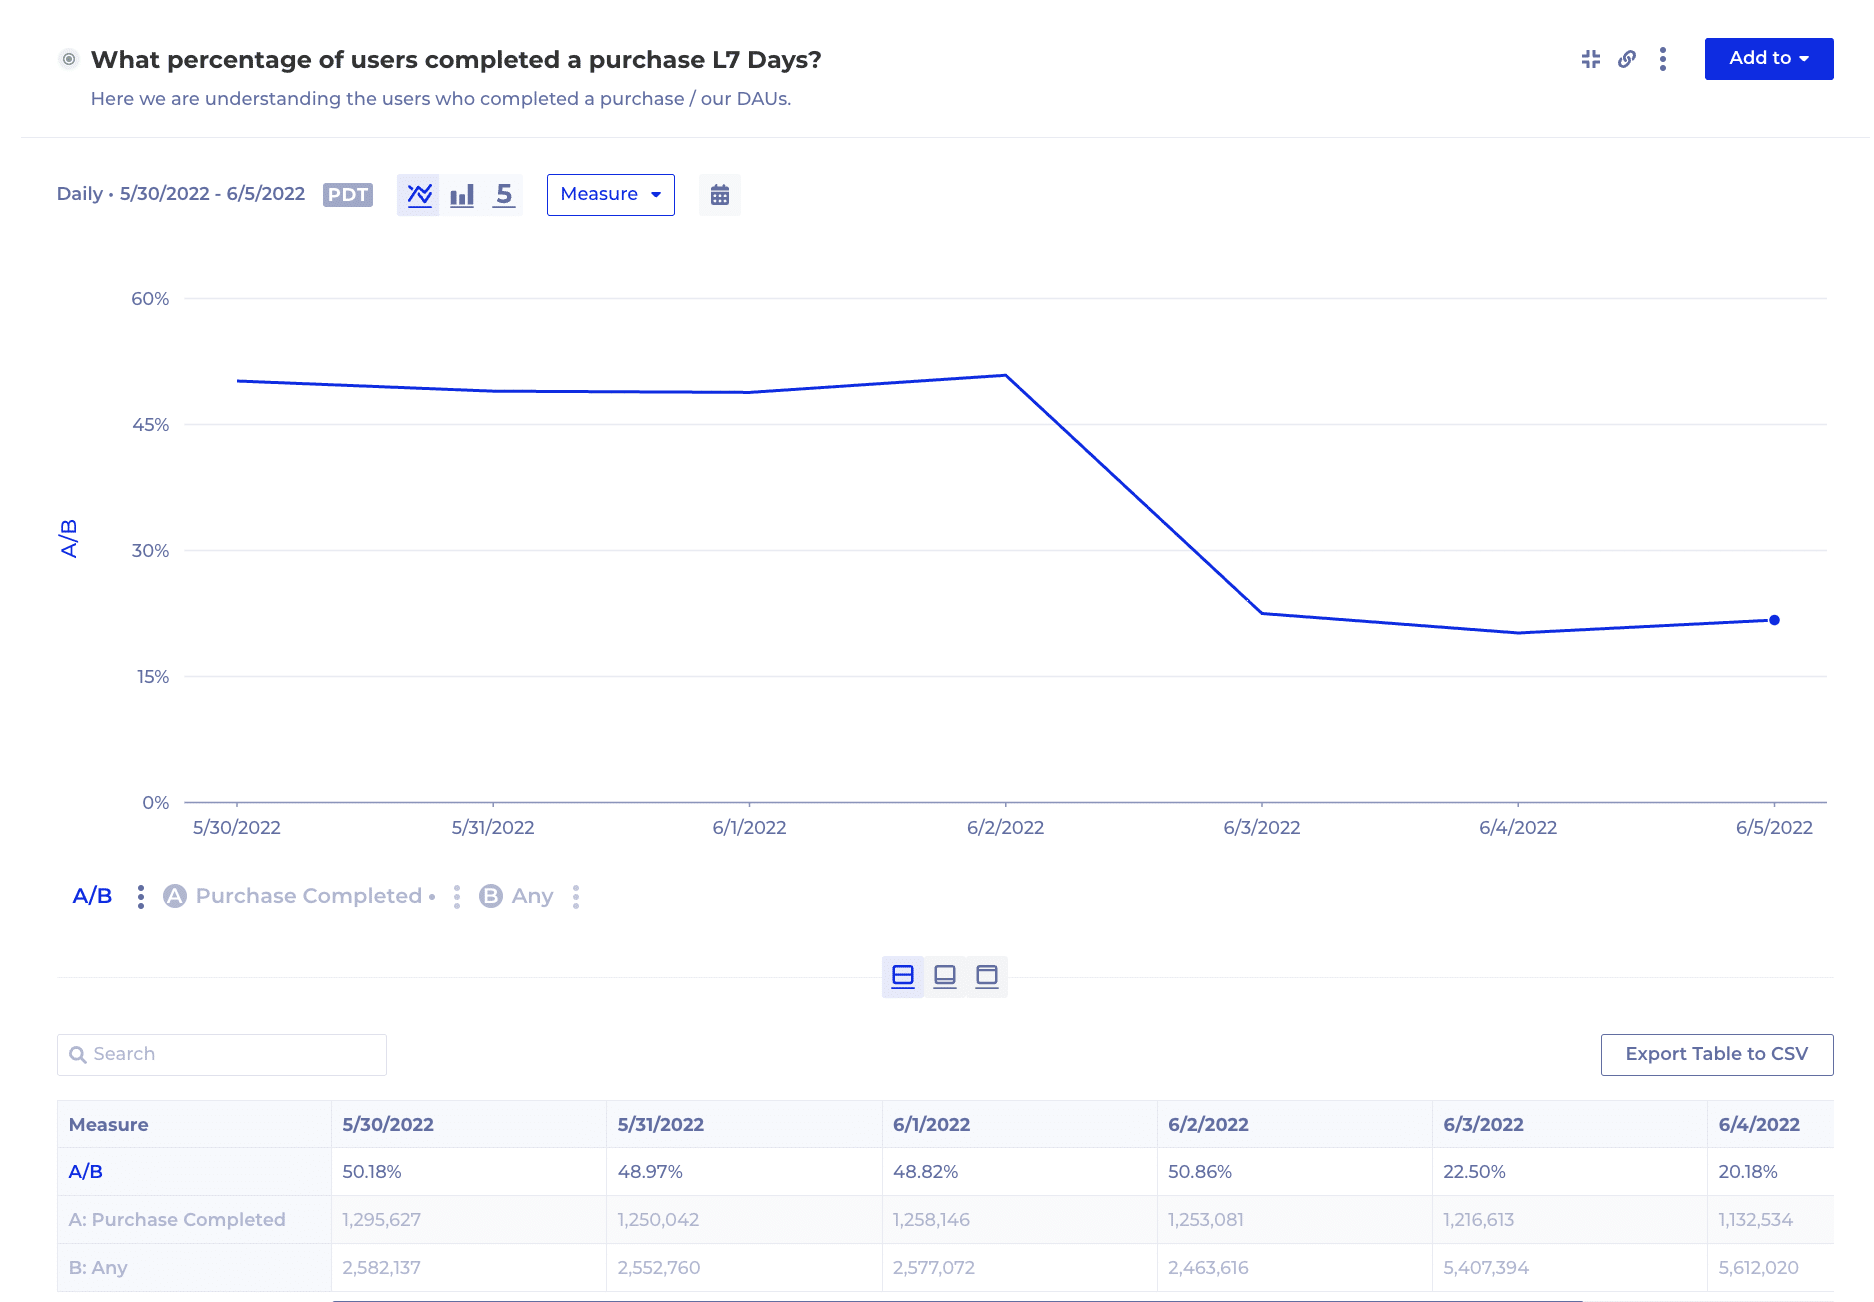
Visualize metrics over time using Kubit’s Query report. You can break down metrics by valuable data points to quickly surface high and low performance. Drill deeper into each data point for granular information. Data can be visualized using line bars, stacked bars, or pie charts.
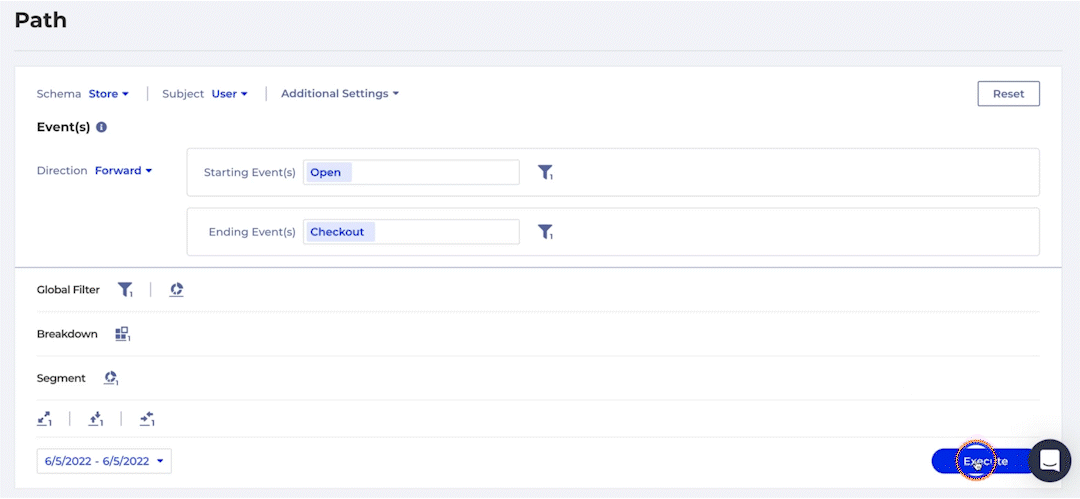
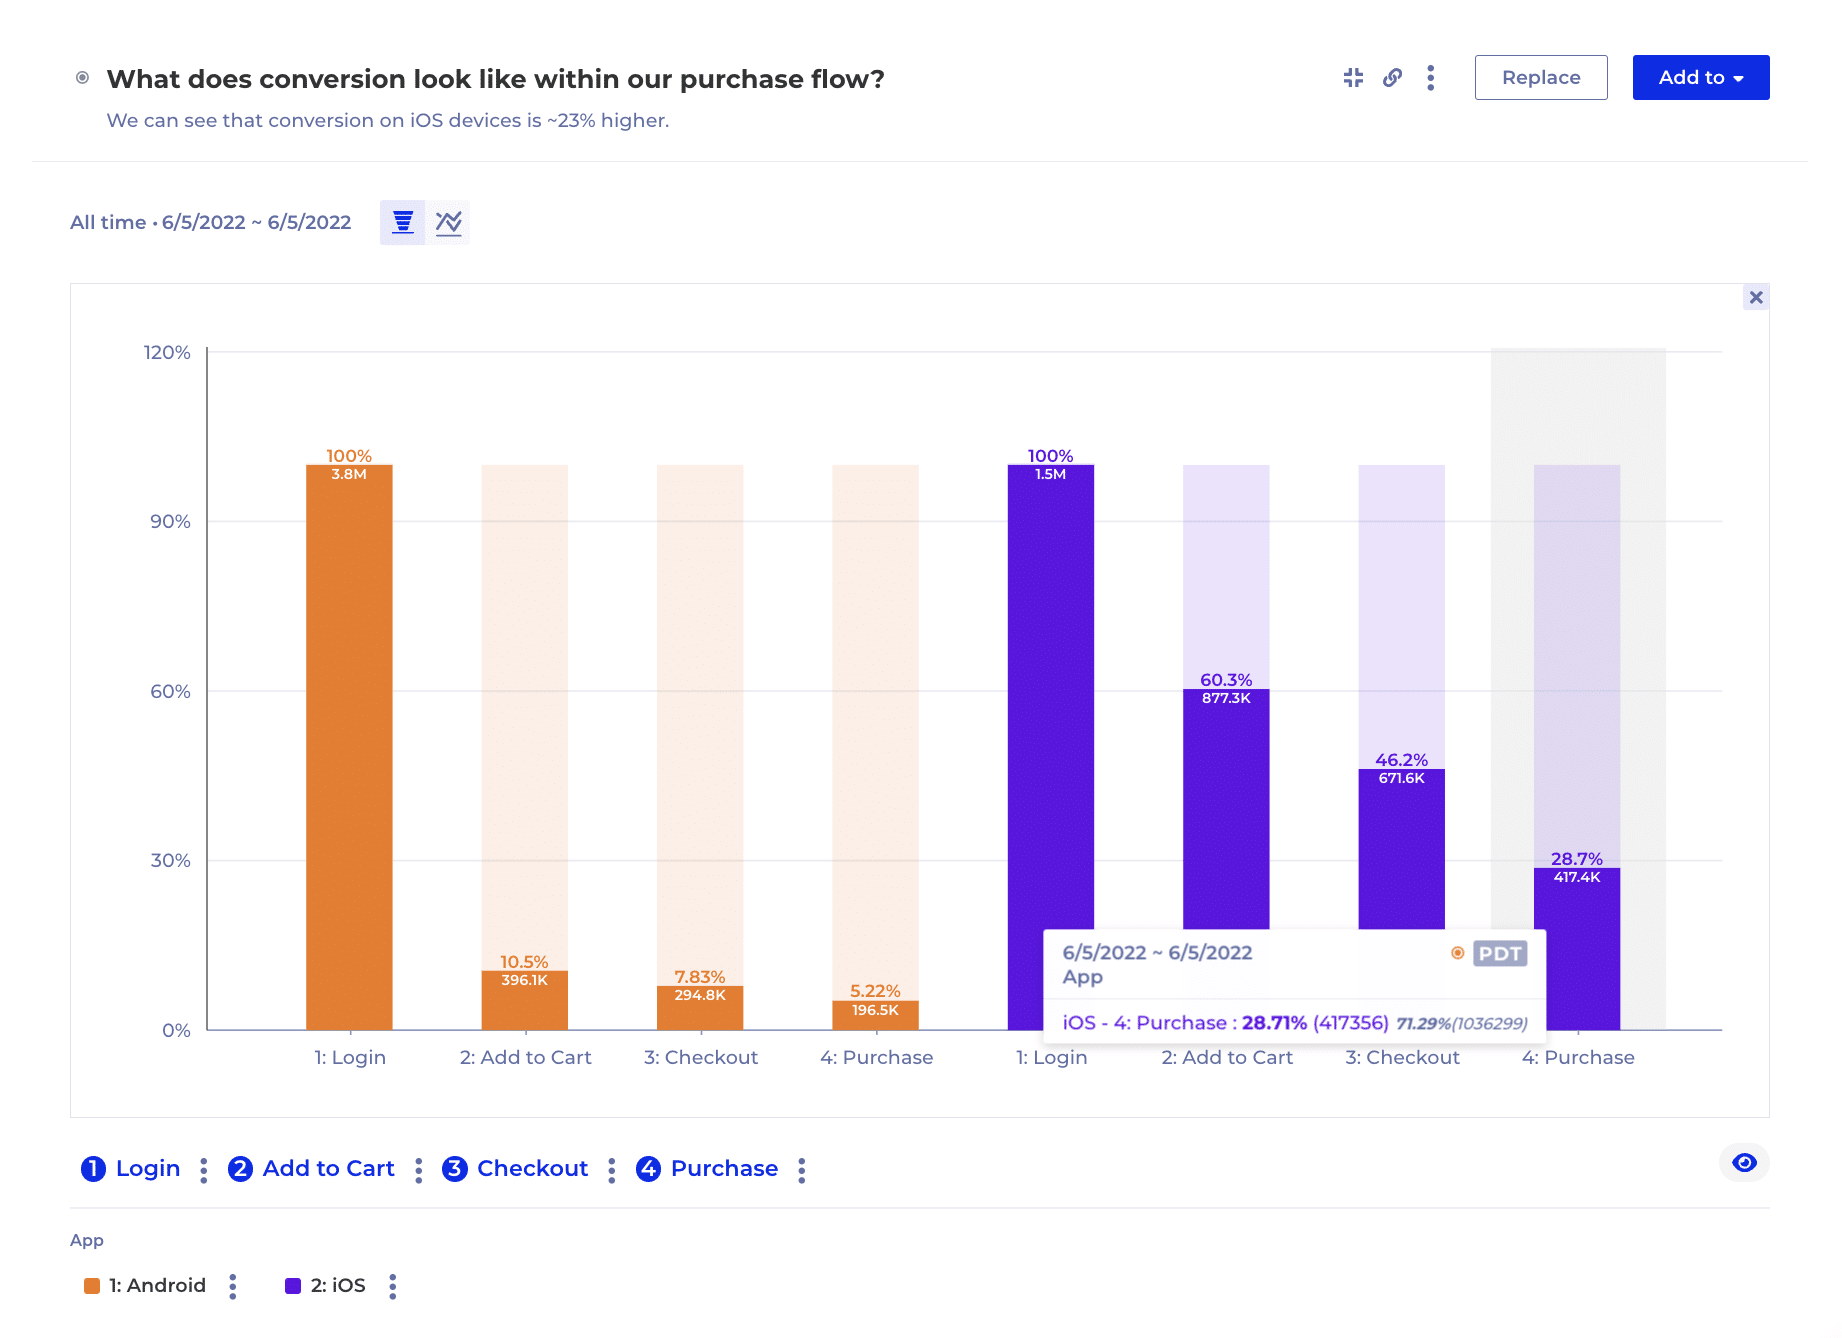
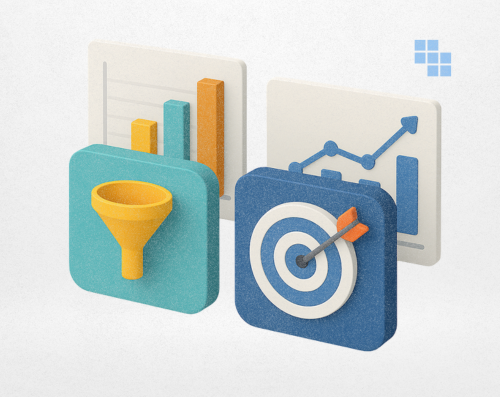
Funnel conversions
Understand how customers are converting through key flows within your product. Within a funnel, you can see drop-off and conversion metrics with the ability to break down or segment funnels based on additional data. Data can be visualized using traditional conversion, conversion over time, and frequency before conversion.
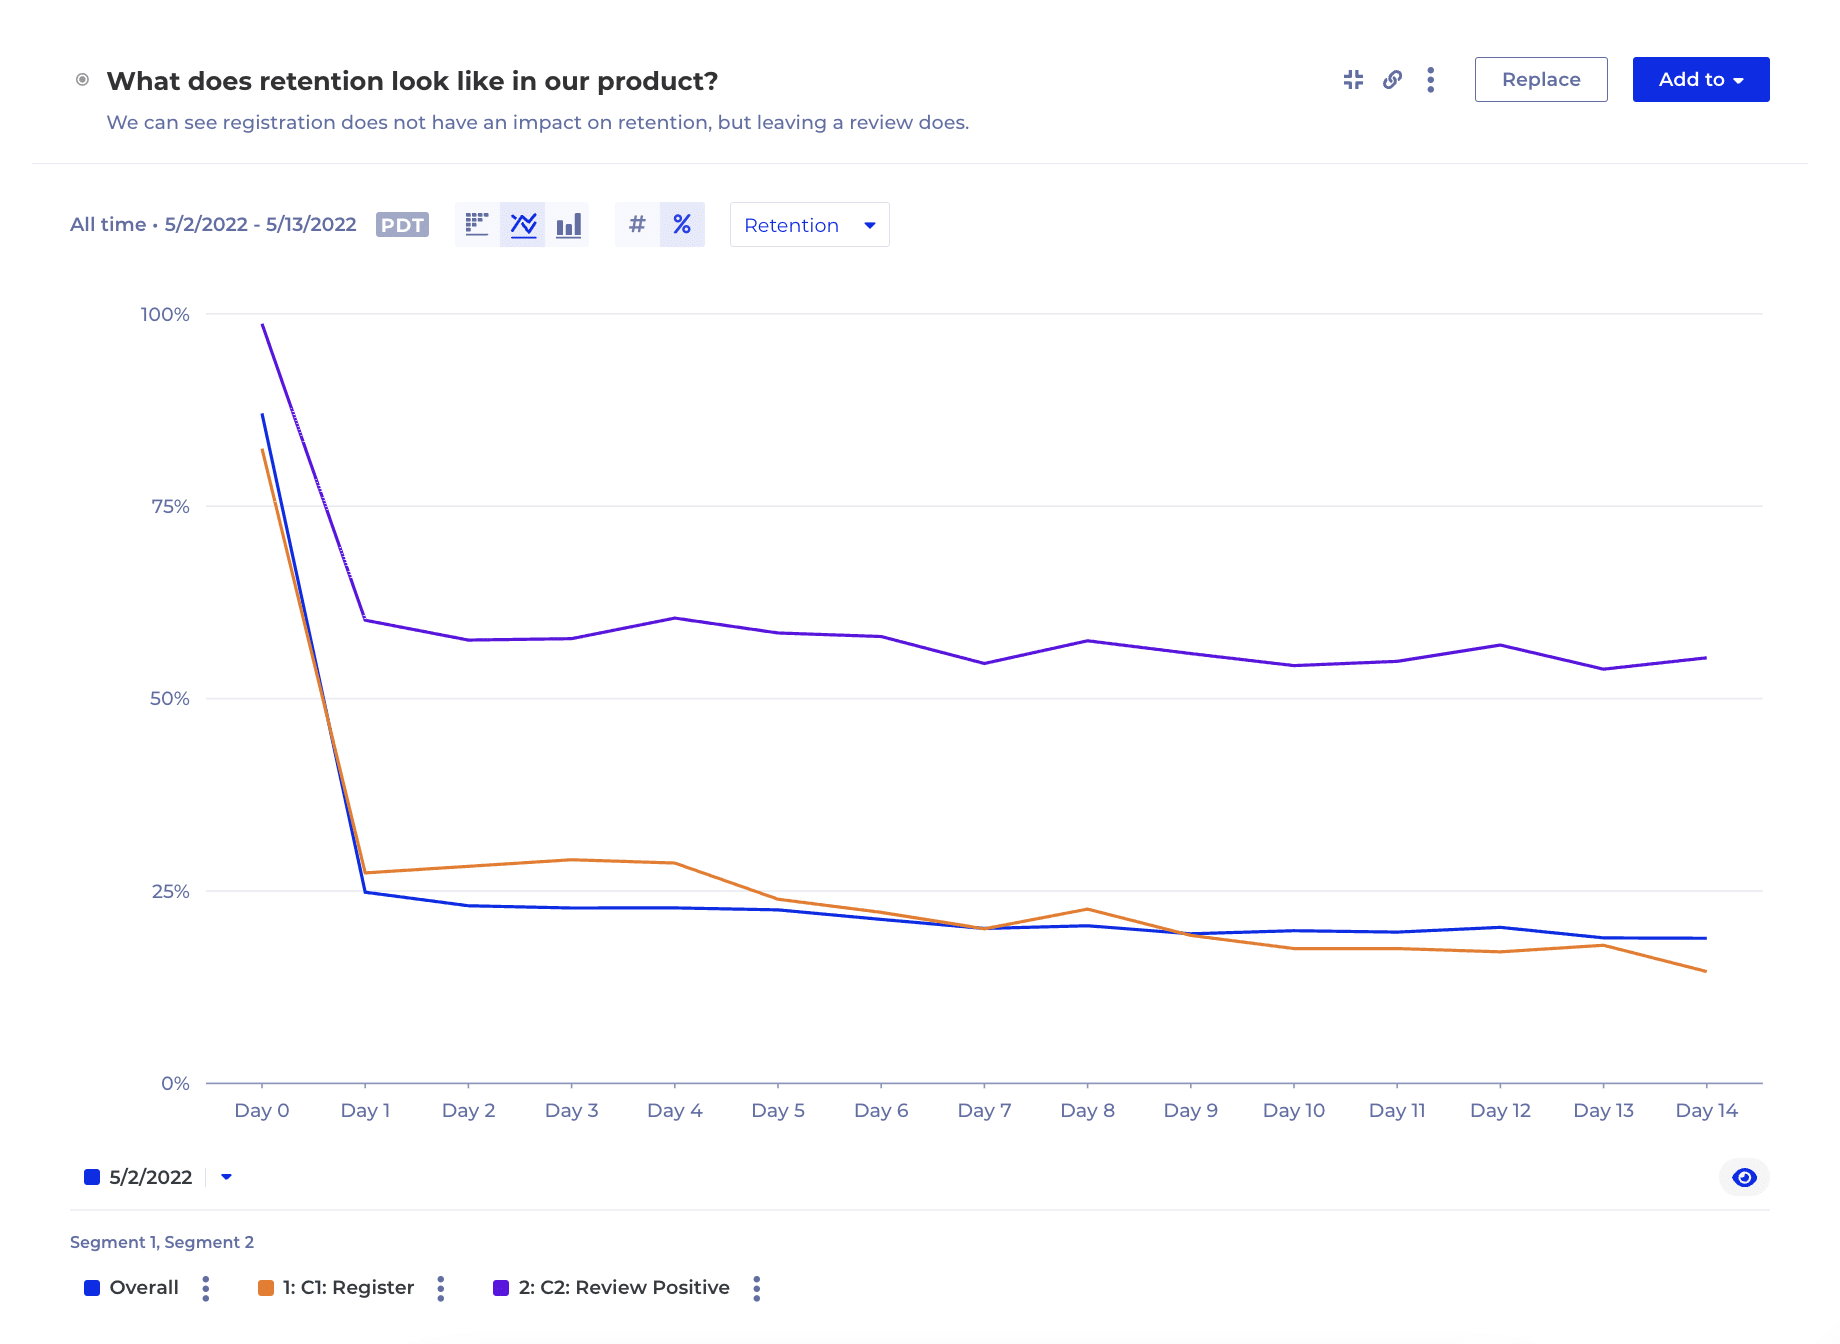
User retention
Learn which users return, or never come back to utilize core features and how consistently they retain in the following days. You can construct a retention model that fits your needs as well as decide how you want to visualize this critical metric whether it be retention or churn rates. You are able to analyze your Retention Model as a standard retention curve, retention over time, or usage intervals.
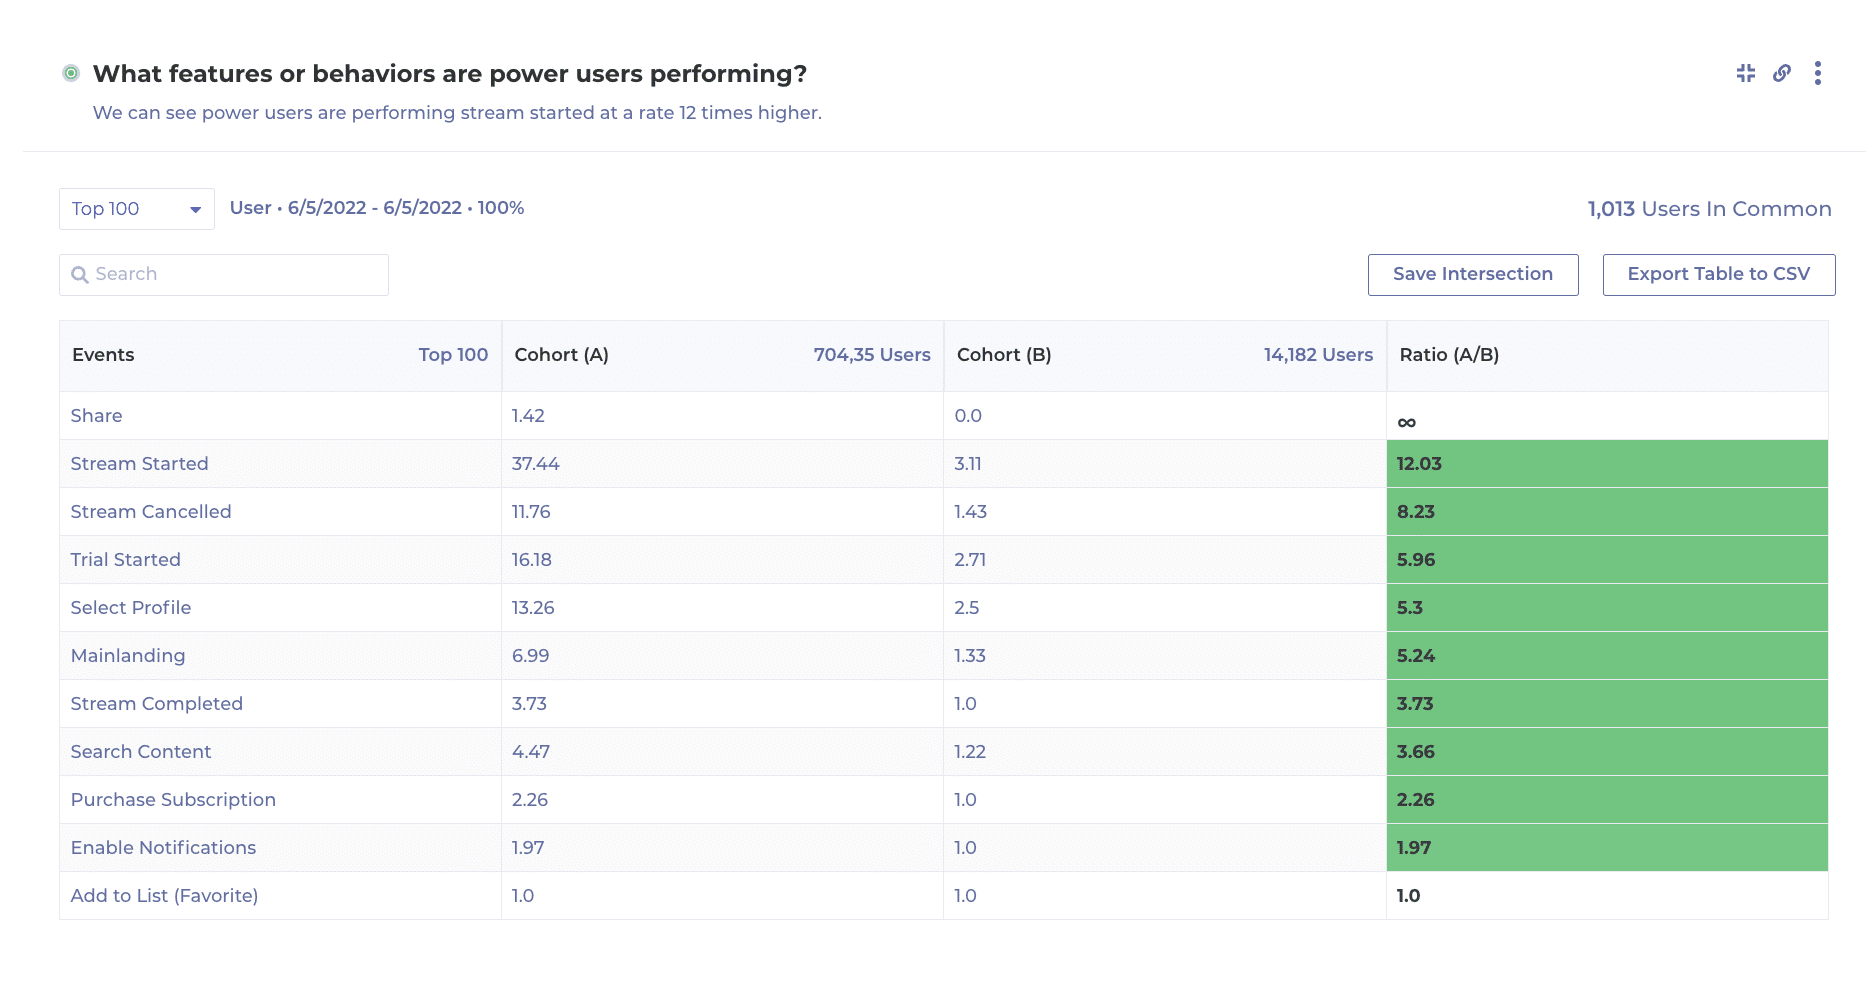
Behavioral cohorts
Further analyze individuals contained within your data points. You can create cohorts on the fly or by defining them in the Cohort builder. Once a cohort is created, you can reuse it as a segment in any analysis, compare two cohorts, or sync them to a third-party tool to drive targeted outreach.
Case Studies:
Learn how Miro democratized data across their organization—beyond the data team alone.
We use cookies to enhance your browsing experience, serve personalised content, and analyse our traffic. By clicking “Accept”, you consent to our use of cookies.